- Blue Chip Portfolios's Newsletter
- Posts
- The Blue Chip Portfolios Moderate Risk Portfolio
The Blue Chip Portfolios Moderate Risk Portfolio
In today’s post I will be giving you a look inside one of the Blue Chip Portfolios model portfolios: the Blue Chip Portfolios moderate risk ETF model portfolio.
While “moderate risk” means different things to different people, I believe a traditional 60/40 portfolio represents a reasonable moderate risk portfolio. Thus, I benchmark the Blue Chip Portfolio moderate risk ETF portfolio against a typical 60/40 portfolio. The benchmark consists of 60% invested in the Vanguard Total Stock Market Index Fund ETF (VTI) and 40% invested in the iShares Core U.S. Aggregate Bond ETF (AGG).
One reasonable question you might ask is why I am not using global ETFs such as the Vanguard Total World Stock Index Fund (VT) and the Vanguard Total World Bond ETF (BNDW) as part of the benchmark. The reason is that most investors, especially in the U.S. exhibit a high degree of home country bias in their portfolios. Thus, a 60/40 portfolio made up of U.S. stocks and bonds is more representative of how most people in the U.S. actually invest.
In my previous piece How To Beat A 60/40 Portfolio I discussed many of the tactics which can be used to build a superior portfolio. The portfolio allocations below represent my views on how best to use these concepts to build an optimal portfolio which aims to outperform a 60/40 portfolio.
In terms of designing and updating this portfolio, my approach is to consider both structural considerations as well as my views for various asset classes. For example, my decision to hold a small allocation to the KFA Mount Lucas Managed Futures Index Strategy is driven by views shared in my previous piece Should You Own Managed Futures Funds? Generally speaking, I would expect to have exposure to managed futures of 1% - 10% depending on my views on other parts of the portfolio. The 1%-10% exposure range is generally structural in nature while the weight at any given time is a reflection of my market views.
Portfolio Holdings
Alternatives (7% of Total Portfolio)
iShares Bitcoin Trust ETF (IBIT): 1%
KFA Mount Lucas Managed Futures Index Strategy ETF (KMLM): 3%
iShares Gold Trust (IAU): 3%
Fixed Income (27% of Total Portfolio)
Janus Henderson AAA CLO ETF (JAAA): 3%
Janus Henderson B-BBB CLO ETF (JBBB): 3%
iShares J.P. Morgan USD Emerging Markets Bond ETF (EMB): 3%
iShares Fallen Angels USD Bond ETF (FALN): 3%
Vanguard Extended Duration Treasury ETF (EDV): 7%
Invesco Taxable Municipal Bond ETF (BAB): 8%
Equity (66% of Total Portfolio)
iShares Emerging Markets Equity Factor ETF (EMGF): 4%
iShares Currency Hedged MSCI EAFE ETF (HEFA): 5%
Utilities Select Sector SPDR Fund (XLU): 7%
Vanguard Total Stock Market Index Fund ETF (VTI): 25%
Schwab U.S. Broad Market ETF (SCHB): 25%
Key Differences From Benchmark
The model portfolio has 7% exposure to alternative assets (gold, managed futures, and bitcoin) while the benchmark has no exposure to alternatives.
The model portfolio has 12% exposure to foreign securities ( via EMB, EMGF, and HEFA) while the benchmark has no exposure to foreign securities.
The model portfolio has a total portfolio duration of 2.7 years while the benchmark has a duration of 2.44 years. Thus the model portfolio has slightly more exposure to interest rates.
The model portfolio has significantly more exposure to the Utilities sector (8.4% of equity exposure vs 1.4% in the benchmark).
The model portfolio has moderate 6% exposure to structured credit (JAAA and JBBB) while the benchmark does not.
The model portfolio has moderate exposure to taxable municipal bonds (8%) while the benchmark does not.
The model portfolio is diversified in terms of fund managers with ETFs managed by Vanguard, Schwab, Janus Henderson, State Street, BlackRock, Invesco, and KFA while the benchmark only has exposure to Vanguard and BlackRock.
Key Similarities vs Benchmark
The model portfolio and 60/40 benchmark both have fairly low expense ratios. The model portfolio has a net expense ratio of 0.15% while the 60/40 portfolio has a net expense ratio of 0.03%.
The model portfolio and its benchmark both get the vast majority of equity exposure via market cap weighted indexes.
The model portfolio and its benchmark have similar fixed income credit quality as both have an average fixed income security credit quality of A.
The model portfolio and benchmark have a similar level of total equity market exposure (66% vs 60%) and a similar amount of U.S. equity exposure (57% vs 60%).
Historical Performance
While past performance is not necessarily an indicator of future performance, I believe looking at past performance of a portfolio can be helpful to determine if it exhibits excess risk vs benchmark and if structural tilts have delivered as anticipated historically.
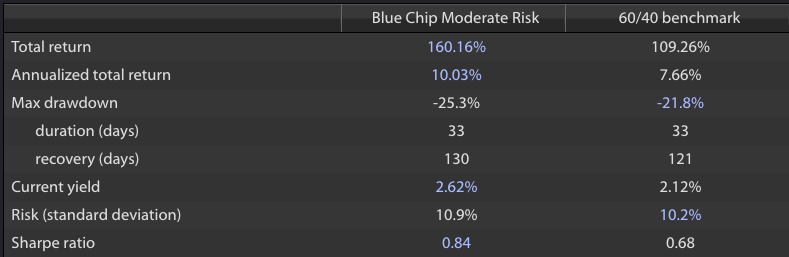
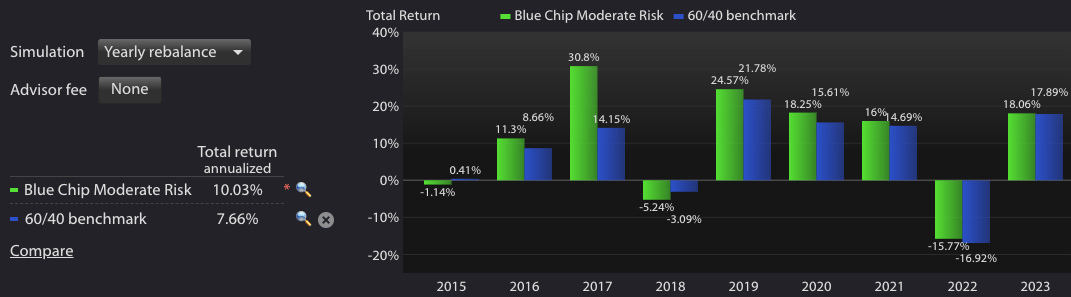
The metrics below show performance of the Blue Chip Moderate Risk portfolio compared to the 60/40 benchmark. Calculations are performed using Kwanti, a portfolio analytics software. While most of the ETFs included above have long performance histories, a few do not. In cases where a fund does not have a long performance history a proxy is used. For example, IBIT is a newly launched Bitcoin ETF which does not have much historical performance data. Thus, the total return of Bitcoin itself is used for periods before IBIT launched. Similarly, EMGF is a relatively new ETF which does not have a long history so performance data for the MSCI Emerging Markets index is used for periods before EMGF launched. Performance is inclusive of fees on all ETFs.
As shown in the analysis below, the Blue Chip Moderate risk portfolio has delivered an annualized return of 10.03% over the past 10 years compared to a 7.66% annualized total return delivered by a traditional 60/40 portfolio. While the outperformance is impressive, we must also consider the relative levels of risk. The Blue Chip Moderate risk portfolio has exhibited an annual standard deviation of 10.9% over the past 10 years compared to a 10.2% annual standard deviation realized by the 60/40 portfolio. Thus, the model portfolio has achieved significantly more return with just a modest amount of added risk and thus achieved a much better sharpe ratio.
Kwanti
Kwanti

Kwanti
Model Portfolio Stress Testing
Another helpful tool to analyze risk in the portfolio is stress testing. As shown by the chart below, the model portfolio has performed similarly to the benchmark during most historical market events. This historical performance suggests that the model portfolio exhibits a similar level of risk to the benchmark which is impressive given the historical outperformance.

Thank you for reading. If you enjoyed this article and believe it was value additive please consider sharing it with friends or colleagues who you think may be interested and encouraging them to subscribe to the Blue Chip Portfolio’s Newsletter here: https://bluechipportfolios.beehiiv.com/
Questions, comments, or feedback? Please email us at [email protected]
Blue Chip Portfolios is a publisher of financial information and is not an investment advisor. Blue Chip Portfolios does not provide personalized or individualized investment advice. Information provided is not tailored to the needs of any particular recipient. Blue Chip Portfolios does not guarantee the accuracy or completeness of the information provided in this page. All statements and expressions herein are the sole opinion of the author or advertiser.
THE INFORMATION ON THIS WEBSITE IS NOT AND SHOULD NOT BE CONSTRUED AS INVESTMENT ADVICE. INFORMATION PUBLISHED ON THE SITE DOES NOT PURPORT TO BE AND DOES NOT EXPRESS ANY OPINION AS TO THE PRICE AT WHICH THE SECURITIES OF ANY COMPANY MAY TRADE AT ANY TIME. THE INFORMATION AND OPINIONS PROVIDED HEREIN SHOULD NOT BE TAKEN AS SPECIFIC ADVICE ON THE MERITS OR CONSIDERATIONS OF ANY INVESTMENT DECISION. INVESTORS SHOULD DO THEIR OWN RESEARCH AND MAKE THEIR OWN DECISIONS REGARDING THE PROSPECTS OF ANY COMPANY DISCUSSED HEREIN. INVESTORS SHOULD NOT RELY ON THE INFORMATION CONTAINED HEREIN. INVESTORS SHOULD OBTAIN INDIVIDUAL INVESTMENT ADVICE BASED ON THEIR OWN SITUATION BEFORE MAKING ANY INVESTMENT DECISIONS
No expression of opinion or statement, or any other matter herein, directly or indirectly, is a solicitation or offer to buy or sell the securities or financial instruments mentioned.
The author, publisher or insiders of the publisher may currently have long or short positions in the securities of the companies mentioned, or may have such a position in the future (and therefore may profit from movements in the trading price of the securities). To the extent such persons do have such positions, there is no guarantee that such persons will continue to maintain such positions.
Any projections, outlooks or estimates herein are forward looking projections and are thus inherently unreliable. They are based upon assumptions and should not be construed to be indicative of the actual events that will occur. Other events that have not been taken into account may occur and may significantly alter the returns or performance of the securities discussed herein. The information provided herein is based on matters as they exist as of the date of preparation and not as of any future date, and Blue Chip Portfolios undertakes no obligation to correct or update the information in this document or to otherwise provide any additional material.
Blue Chip Portfolios does not accept any liability whatsoever for any direct or consequential loss howsoever arising, directly or indirectly, from any use of the information contained herein.
By using the Site or any related social media account, you are indicating your consent and agreement to this disclaimer and our terms of use. Unauthorized reproduction of this newsletter or its contents by photocopy, facsimile or any other means is illegal and punishable by law.