- Blue Chip Portfolios's Newsletter
- Posts
- How To Ride Out A Stock Market Storm: Part 1
How To Ride Out A Stock Market Storm: Part 1
I was recently asked for advice regarding how to ride out a challenging stock market.
My viewpoint regarding how to ride out a market storm is much more nuanced than the typical “do nothing”, “buy the dip”, or “don’t panic” advice given out by many financial market commentators.
As a starting point, one of the keys to being able to weather a stock market storm as an individual investor is not coming into the situation with more risk than you can tolerate. Two individuals could have the exact same financial and life circumstances but have very different risk tolerances.
During bull markets, investors may take more risk than they can tolerate in hopes of achieving stronger returns. Another way investors can end up taking more risk than they can tolerate is a lack of rebalancing which tends to lead to more equity exposure overtime. For example, let’s suppose an investor initial allocated 60% to equities and 40% to bonds. If we assume no rebalancing, a 10% annual return for equities, and a 5% annual return for bonds the portfolio mix will shift to 70% equities and 30% bonds 10 years later. After 15 years, the mix will become 75% equities and 25% bonds.
The problem comes once an inevitable market downturn occurs. An investor who has taken more risk than they can tolerate will be in over their skis and become more likely to sell and may unload their investments at the worst possible time.
How much can the stock market fall?
When thinking about how far and how quickly stocks can fall, it is relevant to look to a few historic equity market declines.
2020 COVID-19 Sell Off
The covid market collapse began on February 20, 2020. The S&P 500 fell by ~34% and bottomed on March 23, 2020. The stock market bounced back rapidly and made new highs by mid August 2020.
2008 Financial Crisis
The global financial crises sell off started on October 9, 2007. The S&P 500 fell by ~57% and bottomed on March, 9 2009. The stock market bounced back slowly and did not surpass its 2007 peak until mid 2012.
Dot-Com Bubble
The dot-com bubble burst on March 24, 2000. The S&P 500 fell by ~49% and bottomed on October 9, 2002. The stock market bounced back slowly and did not make a new high until August 2007.
1987 Crash
On Monday October 19, 1987 the stock market experienced its largest one-day percentage drop in history with the S&P 500 falling by ~20%. The total drop from the all time high reached in August 1987 to the market bottom reached on December 4, 1987 was ~33%. The stock market bounced back fairly rapidly and reached a new high in 1989.
1929 Crash & Great Depression
The stock market which began in 1929 and led to the great depression stands out as particularly brutal due to the size of the decline and the amount of time it took for the market to fully recover. From its peak reached in August 1929 to bottom reached in June 1932 the S&P 500 dropped by 86%. The stock market would not reach a new high until 1954.
One interesting thing to note about the 1929 crash is that stocks were actually not crazy expensive with the DJIA trading at ~15x earnings. The takeaway here is that massive market declines can happen from seemingly low / reasonable valuations.

Could a 1929 style crash and prolonged stock market weakness happen again?
Some financial pundits dismiss the possibility of another prolonged period of stock market declines similar to what occurred in 1929. Clearly, some things have changed for the better since 1929. The financial system is much more regulated and less risky than was the case in 1929. Moreover, policy makers have a much better understanding of what the appropriate response is to different economic challenges. However, other things have changed which create new risks that were not present in 1929.
One key risk that the global economy faces today is geopolitical risk. More specifically, the risk of nuclear warfare is a feature of the world today which was not present in 1929. While the risk of nuclear warfare is very low, it is not zero. This is particularly true given geopolitical tensions driven by wars in Ukraine and the Middle East. A large scale nuclear war has the potential to wipe out large parts of the global population and unleash economic havoc which may take decades to recover from.
Another risk that the global economy faces today is the large debt accumulated by some of the largest economies in the world. In particular, the U.S., Japan, and a number of EU countries. Currently, the U.S. debt-to-GDP ratio is ~120%. This is a level only rivaled during World War II. Moreover, the debt burden is only expected to rise from current levels. The Congressional Budget Office expects the U.S. public debt burden to rise to 181% of GDP by 2053. The debt-to-GDP ratio in Japan is a staggering ~263%.
While a public debt crisis does not appear imminent, the conditions certainly exist for a massive pubic debt crisis in the U.S., Europe, Japan, and other countries. Predicting the likelihood, timing, and catalyst of such an event is difficult but the reality is the current state of public finances is much worse than was the case in 1929. The risk of a brutal economic decline related to this problem cannot be ruled out.
These are just two possible causes of a potentially prolonged economic downturn.
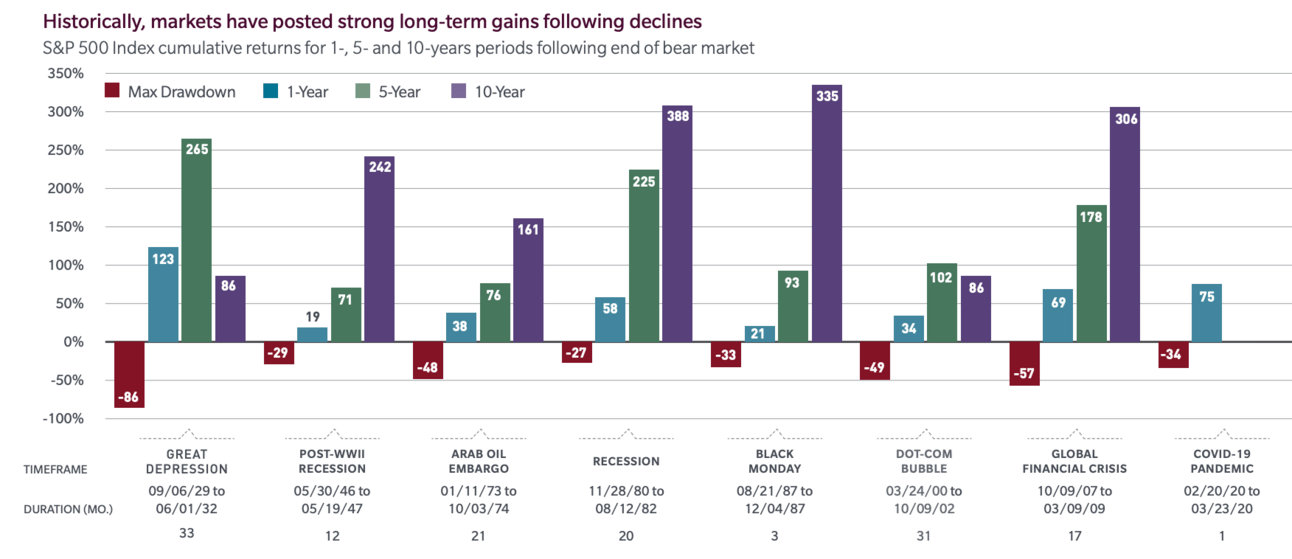
Equity Markets Have Generally Posted Strong Gains Following Declines… But not all the time
As shown by the chart below, equity markets tend to post strong gains following a sharp decline. Thus, in most cases “buying the dip” tends to work. However, the challenge is that every once in a while it does not work.
For example, on October 28, 1929 the stock market experienced a crash with the Dow falling by 12.8% and closing at 260.64. The following day, the Dow dropped another 11.7% and closed at 230.07. The market would continue falling until 1932 when the Dow reached a closing low of 41.22. Thus, in 1929 the right move was to actually sell the dip as the market would fall an additional 82%. As shown by the chart above, the Dow would not recover to the 230 level until the mid 1950s.
Some pundits might be tempted to say that 1929 is an extreme example and should be ignored. While I believe the points I made above regarding potential risks to the current system should have you challenging this view point, there is another real life example you should be aware of: Japan.
Japan’s Nikkei 225 Index, the most significant equity market index in Japan, reached an all-time high of 38,195 on December 29, 1989. Today, 34 years later the Nikkei 225 Index sits at 33,464 which is still well below 1989 levels. The collapse in Japan was driven by the collapse of an asset bubble which led stocks to trade at ~60x trailing earnings.
Source: MFS Investment Management
How To Ride Out A Stock Market Storm
If you have read down to here in the article you likely realize that managing a stock market downturn is much more difficult than traditional viewpoints suggest.
The challenge here is that doing nothing or buying the drip works most of the time but when it does not work the consequences can be dire (e.g. 1929 in the U.S. and 1989 in Japan.)
As noted towards the beginning of this article one of the most important things an investor can do to ride out a market storm is to ensure that they are not taking more risk than they can tolerate before a market storm hits. However, this is just one part of my stock market storm playbook.
I think this article has gone on long enough and thus the rest of my market crash playbook will be released via a Part 2 of this article in a separate post.
Thank you for reading. If you enjoyed this article and believe it was value additive please consider sharing it with friends or colleagues who you think may be interested and encouraging them to subscribe to the Blue Chip Portfolio’s Newsletter here: https://bluechipportfolios.beehiiv.com/
Questions, comments, or feedback? Please email us at [email protected]
Blue Chip Portfolios is a publisher of financial information and is not an investment advisor. Blue Chip Portfolios does not provide personalized or individualized investment advice. Information provided is not tailored to the needs of any particular recipient. Blue Chip Portfolios does not guarantee the accuracy or completeness of the information provided in this page. All statements and expressions herein are the sole opinion of the author or advertiser.
THE INFORMATION ON THIS WEBSITE IS NOT AND SHOULD NOT BE CONSTRUED AS INVESTMENT ADVICE. INFORMATION PUBLISHED ON THE SITE DOES NOT PURPORT TO BE AND DOES NOT EXPRESS ANY OPINION AS TO THE PRICE AT WHICH THE SECURITIES OF ANY COMPANY MAY TRADE AT ANY TIME. THE INFORMATION AND OPINIONS PROVIDED HEREIN SHOULD NOT BE TAKEN AS SPECIFIC ADVICE ON THE MERITS OR CONSIDERATIONS OF ANY INVESTMENT DECISION. INVESTORS SHOULD DO THEIR OWN RESEARCH AND MAKE THEIR OWN DECISIONS REGARDING THE PROSPECTS OF ANY COMPANY DISCUSSED HEREIN. INVESTORS SHOULD NOT RELY ON THE INFORMATION CONTAINED HEREIN. INVESTORS SHOULD OBTAIN INDIVIDUAL INVESTMENT ADVICE BASED ON THEIR OWN SITUATION BEFORE MAKING ANY INVESTMENT DECISIONS
No expression of opinion or statement, or any other matter herein, directly or indirectly, is a solicitation or offer to buy or sell the securities or financial instruments mentioned.
The author, publisher or insiders of the publisher may currently have long or short positions in the securities of the companies mentioned, or may have such a position in the future (and therefore may profit from movements in the trading price of the securities). To the extent such persons do have such positions, there is no guarantee that such persons will continue to maintain such positions.
Any projections, outlooks or estimates herein are forward looking projections and are thus inherently unreliable. They are based upon assumptions and should not be construed to be indicative of the actual events that will occur. Other events that have not been taken into account may occur and may significantly alter the returns or performance of the securities discussed herein. The information provided herein is based on matters as they exist as of the date of preparation and not as of any future date, and Blue Chip Portfolios undertakes no obligation to correct or update the information in this document or to otherwise provide any additional material.
Blue Chip Portfolios does not accept any liability whatsoever for any direct or consequential loss howsoever arising, directly or indirectly, from any use of the information contained herein.
By using the Site or any related social media account, you are indicating your consent and agreement to this disclaimer and our terms of use. Unauthorized reproduction of this newsletter or its contents by photocopy, facsimile or any other means is illegal and punishable by law.