- Blue Chip Portfolios's Newsletter
- Posts
- 2024 Best Ideas
2024 Best Ideas
It is that time of year again as many investment firms and investing world personalities have been releasing their best ideas for 2024.
One thing that is not discussed enough is how difficult predictions regarding future markets moves truly are.
At the end of 2022, consensus Wall Street estimates called for the S&P 500 to gain 6.2% during 2023. As it turns out, the S&P 500 is now up nearly 26% thus far in 2023. During the period 2000 to 2023 the median Wall Street consensus stock market return target missed the mark by an average of 13.8% annually.
With this in mind, my 2024 best ideas are focused on themes and investment ideas which I believe can work in different market environments.
1. Favor Low Fee Equity Index ETFs over High Fee Actively Managed Mutual Funds
For those of you who have been following me from the start, this recommendation will not come as a surprise. As noted in my very first post here, 3 Essential Things Every Investor Should Know, actively managed funds have failed to beat their benchmarks over long periods of time. The chances of long-term active fund success are generally lowest in U.S. equities with just 9.8% of U.S. Large Blend funds outperforming their passive benchmark over the past 10 years.
In addition to underperforming on an outright basis, many active funds perform even worse when considering after-tax returns. One reason for this is that most actively managed products tend to be mutual funds which are characterized by significant tax inefficiencies relative to ETFs. I discussed this dynamic in my piece ETFs vs Mutual Funds: A Few Things You Need To Know
I do not expect this long-term trend to change and thus one of my best ideas heading into 2024 is that investors should favor passive low cost equity ETFs vs high fee actively managed mutual funds.

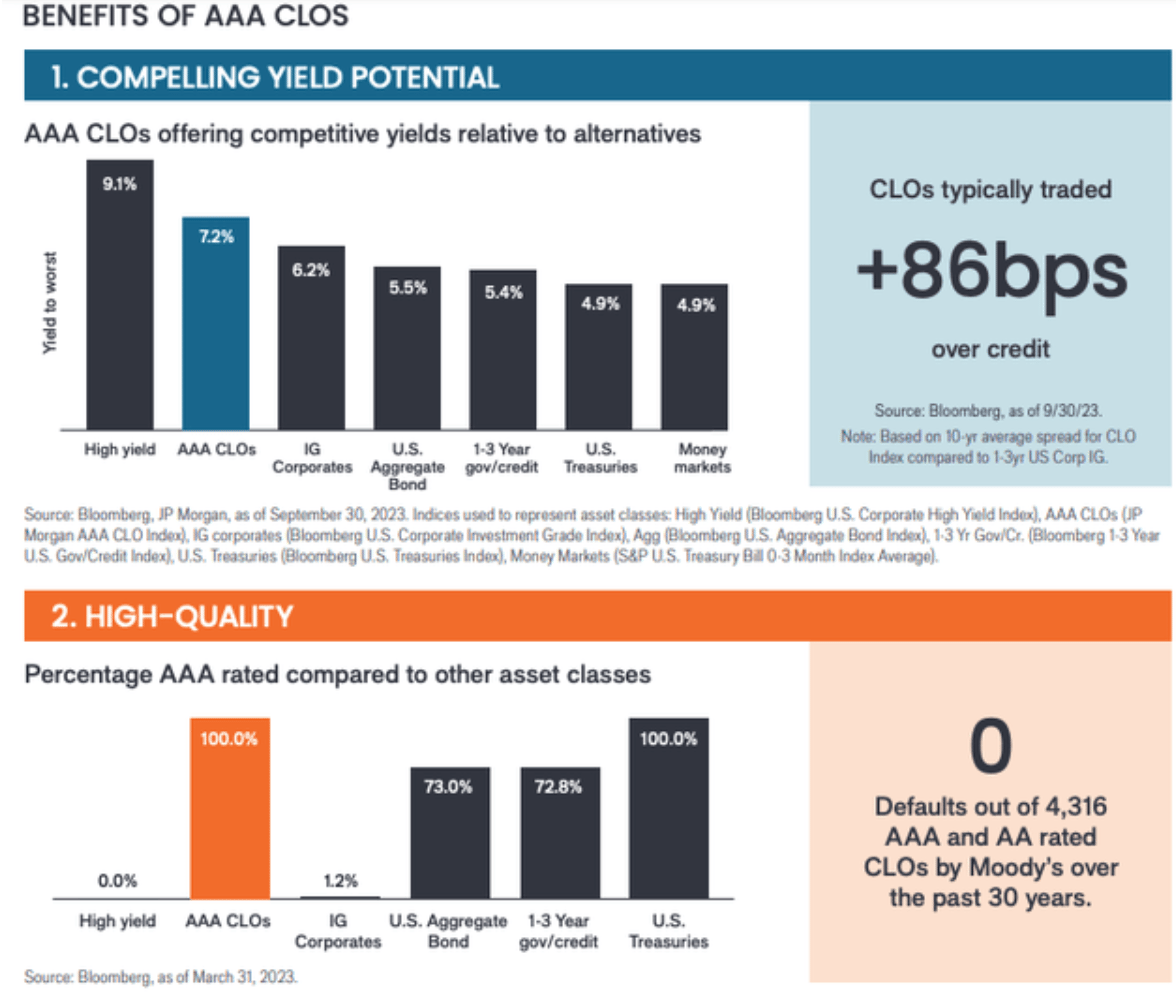
2. Buy AAA CLO ETFs as an alternative to cash or money market funds
One of the most exciting product launches over the past few years has been the launch of low fee AAA CLO ETFs such as the Janus Henderson AAA CLO ETF (JAAA). JAAA launched in 2020 and was the first ETF to provide direct exposure to AAA CLOs. The CLO market is a $700 billion+ asset class that had previously only been available to institutional investors.
AAA CLOs have long been used by active fixed income manager to generate “alpha” vs benchmarks. This has been possible due to the fact that AAA CLOs have historically offered ~85bps of credit spread compared to lower rated corporate borrowers. In addition to offering more spread than high quality corporate bonds, AAA CLOs are in my view a safer investment as no AAA rated CLO has ever defaulted.
Currently, JAAA is characterized by a portfolio with a yield to worst of 7.07%. The fund carries a 30-day SEC yield of 6.8%. Thus, JAAA is offering investors ~167 bps of spread vs U.S. government T bills. To get a sense of how attractive this level of spread is on a relative basis it is useful to compare JAAA to similar corporate bond ETFs.
JAAA is a floating rate vehicle and thus has no material interest rate risk. A comparable corporate bond offering is the VanEck IG Floating Rate ETF (FLTR) which is characterized by a yield to worst of 6.4%. FLTR carries significantly more credit risk as 32% of its holdings are rated BBB. Thus, JAAA offers a better yield and risk profile compared to similar corporate bond securities.
Since inception in October 2020, as shown by the chart below, JAAA has delivered a total return of 10.8% compared to a total return of 6.2% delivered by T- Bills. I expect this outperformance to continue in 2024 even in a more difficult economic environment.

Y Charts
Janus Henderson
3. Favor municipal bonds over similar maturity treasuries
In last week’s post Should You Own Taxable Municipal Bonds I discussed my favorable view of municipal bonds. While municipal bonds are not a sexy investment, they offer an attractive way for investors to generate significantly more yield than U.S. treasuries with a low level of risk.
Investors in low tax brackets should consider taxable municipal bond ETFs such as the Invesco Taxable Municipal Bond ETF (BAB) which is currently characterized by a 5.03% yield to maturity. Comparably, similar maturity U.S. Treasuries such as the 10yr note offer a yield of just 3.9%.
Investors in higher tax brackets should consider tax-free municipal bond ETFs such as the iShares National Muni Bond ETF (MUB) which currently offers a tax equivalent average yield to maturity of 4.94% (based on 37% federal tax.)
Single state municipal bond funds are particularly appealing for high tax bracket individuals living in states with high income tax rates such as New York or California. In addition to being exempt from federal income taxes, municipal bonds tends to be exempt from income taxes in the state they are issued. For example, consider a New York City resident in the highest tax bracket. This individual would face a combined city and state tax bracket of ~14.8% in addition to 37% federal tax. Thus, individuals in the highest tax bracket in New York City face a tax rate of ~51.8%.
The iShares New York Muni Bond ETF (NYF) currently is characterized by an average yield to maturity of 3.13%. On a tax equivalent basis, assuming a 51.8% tax rate, the yield is ~6.5% which represents ~260bps of additional yield compared to similar maturity U.S. government bonds and ~90bps of additional yield vs comparable maturity corporate bonds. NYF’s holdings are very high quality with 28.5% of the portfolio AAA rated, 55.5% of the portfolio AA rated, and 15% of the portfolio A rated.
A comparable corporate bond ETF is the Vanguard Intermediate-Term Corporate Bond ETF (VCIT) which offers an average yield to maturity of 5.6%. In addition to offering a significantly lower yield, VCIT also is characterized by substantially more credit risk. 52% of VCIT’s holdings are rated BBB while 44.2% of holdings are rated A.
4. Overweight duration in portfolio context
The degree of correlation between high quality government bonds and equities has varied significantly over time. Over the past three decades, the long-term average correlation between the ICE BofA 7-10 Year US Treasury Index and the S&P 500 is -0.11.
It is important to note that the correlation has not been stable and has been highly volatile. The 1990s were a period of high positive correlations while the period from 2000 to 2021 was a period of highly negative correlations. 2022-2023 marked a significant period of positive correlations between stocks and bonds. The result of this is that high quality bonds failed to provide much protection for portfolios during the 2022 equity market sell-off and during periods of equity market weakness in mid 2023.
When considering asset allocation decisions, the expected correlation between assets is very important. High quality bonds become much less appealing vs equities if returns are expected to be highly correlated. On the other hand, high quality bonds are much more appealing in the event correlations are expected to be highly negative.
The positive correlation over the past two years has been driven by high levels of inflation which led to rising interest rates. The result was that bonds and stocks often moved together as lower inflation was a positive for both assets while higher inflation was a negative for both assets.
I believe this dynamic is poised to change in 2024. High levels of interest rates have taken a toll on large parts of the economy. Inflation has returned back to ~3% and appears to be trending lower from here. My view is that any significant further drop in inflation threatens to send the economy into a deflationary tailspin which would be bullish for bonds but bearish for stocks. On the other hand, stable or modestly higher inflation is likely to be driven by strong economic growth which would be bullish for equities but not bonds. Better than expected economic growth would be a negative for bonds in 2024 as the Fed may be slower to cut rates than what the bond market has already priced in.
For these reasons, I believe the correlation between bonds are stocks is likely to be negative in 2024 and thus investors may benefit from having more exposure to interest rate risk through greater duration.
It should be noted that adding duration does not require reducing stock exposure. Instead investors could consider buying fixed income funds with longer maturities. For example, the Vanguard Extended Duration Treasury Index Fund ETF (EDV) has a duration of ~24.3 years while the Barclays US Agg Index has a duration of ~6.2 years. Thus, even a small allocation shift away from intermediate maturity bonds towards long duration funds such as EDV has potential to increase duration at the portfolio level.

Source: Fisher Investments
5. 10 Single Name Stocks I Am Bullish On
Below is a list of 10 high conviction blue chip stocks that I am bullish on heading into 2024. If you would like to learn more about why I am bullish on these names please consider signing up for our premium service where I will be discussing the case for these stocks and many others.
Meta Platforms (META)
Alphabet (GOOG)
Microsoft (MSFT)
FactSet (FDS)
S&P Global (SPGI)
Visa (V)
MarketAxess (MKTX)
United Healthcare (UNH)
Lockheed Martin (LMT)
Group 1 Automotive (GPI)
Thank you for reading. If you enjoyed this article and believe it was value additive please consider sharing it with friends or colleagues who you think may be interested and encouraging them to subscribe to the Blue Chip Portfolio’s Newsletter here: https://bluechipportfolios.beehiiv.com/
Questions, comments, or feedback? Please email us at [email protected]
Blue Chip Portfolios is a publisher of financial information and is not an investment advisor. Blue Chip Portfolios does not provide personalized or individualized investment advice. Information provided is not tailored to the needs of any particular recipient. Blue Chip Portfolios does not guarantee the accuracy or completeness of the information provided in this page. All statements and expressions herein are the sole opinion of the author or advertiser.
THE INFORMATION ON THIS WEBSITE IS NOT AND SHOULD NOT BE CONSTRUED AS INVESTMENT ADVICE. INFORMATION PUBLISHED ON THE SITE DOES NOT PURPORT TO BE AND DOES NOT EXPRESS ANY OPINION AS TO THE PRICE AT WHICH THE SECURITIES OF ANY COMPANY MAY TRADE AT ANY TIME. THE INFORMATION AND OPINIONS PROVIDED HEREIN SHOULD NOT BE TAKEN AS SPECIFIC ADVICE ON THE MERITS OR CONSIDERATIONS OF ANY INVESTMENT DECISION. INVESTORS SHOULD DO THEIR OWN RESEARCH AND MAKE THEIR OWN DECISIONS REGARDING THE PROSPECTS OF ANY COMPANY DISCUSSED HEREIN. INVESTORS SHOULD NOT RELY ON THE INFORMATION CONTAINED HEREIN. INVESTORS SHOULD OBTAIN INDIVIDUAL INVESTMENT ADVICE BASED ON THEIR OWN SITUATION BEFORE MAKING ANY INVESTMENT DECISIONS
No expression of opinion or statement, or any other matter herein, directly or indirectly, is a solicitation or offer to buy or sell the securities or financial instruments mentioned.
The author, publisher or insiders of the publisher may currently have long or short positions in the securities of the companies mentioned, or may have such a position in the future (and therefore may profit from movements in the trading price of the securities). To the extent such persons do have such positions, there is no guarantee that such persons will continue to maintain such positions.
Any projections, outlooks or estimates herein are forward looking projections and are thus inherently unreliable. They are based upon assumptions and should not be construed to be indicative of the actual events that will occur. Other events that have not been taken into account may occur and may significantly alter the returns or performance of the securities discussed herein. The information provided herein is based on matters as they exist as of the date of preparation and not as of any future date, and Blue Chip Portfolios undertakes no obligation to correct or update the information in this document or to otherwise provide any additional material.
Blue Chip Portfolios does not accept any liability whatsoever for any direct or consequential loss howsoever arising, directly or indirectly, from any use of the information contained herein.
By using the Site or any related social media account, you are indicating your consent and agreement to this disclaimer and our terms of use. Unauthorized reproduction of this newsletter or its contents by photocopy, facsimile or any other means is illegal and punishable by law.